Benefits for your business
-
Monitor your sustainable
business in real timeYou will be able to view the real time data of your contracts and know the amount of CO2 avoided thanks to your contribution. Data on renewable energy certifications will be also available.
-
Manage your activities
and create a connected
businessYou will be able to download and analyze your energy data comparing the performance of your business with respect to your energy needs and your company’s sustainability strategy.
-
Share your contribution
to sustainabilityYou will be able to share your contribution to sustainability highlighting your renewable energy use in your communication with clients and stakeholders.
Dashboard
With the PPA dashboard you can monitor, evaluate
and compare your green energy production and the avoided CO2 to date.
-
Energy Production
10 minute -
Off take General information
-
Resource Availability
10 minute -
YearToDate Production
Monthly -
MonthToDate Production
Daily -
Avoided CO2
-
Weather
Energy Attributes Certificates (EACs)
Look at your total certificates and at the statistics of your imputed EACs of the day or of the month.

In the dashboard you will see
some useful information
about your plant.
Plants' information
- Plant Name
- Country
- Type
- Physical Attributes
according to the plant technology
-
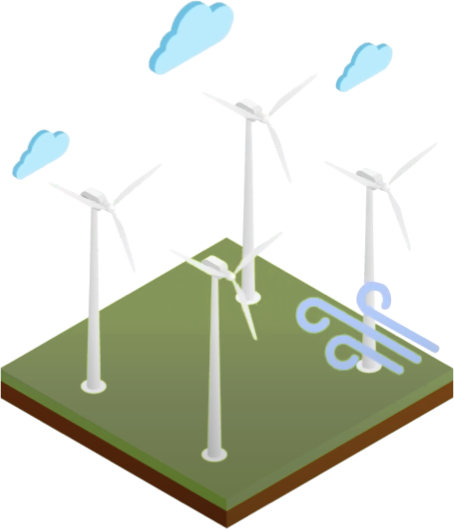
Wind Plants
Actual wind speed and weather.
-
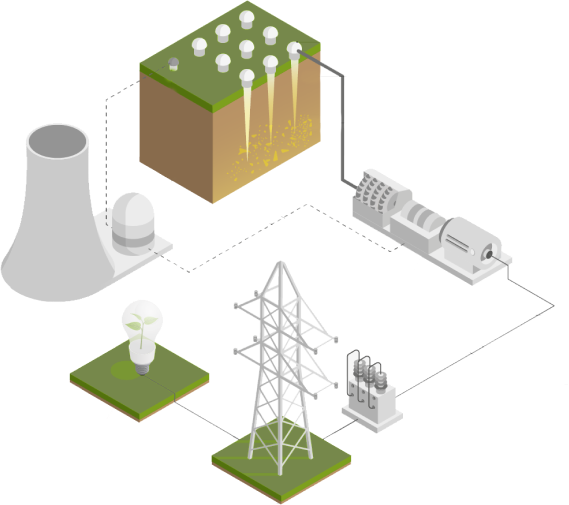
Geothermal Plants
Actual temperature
and precipitations. -
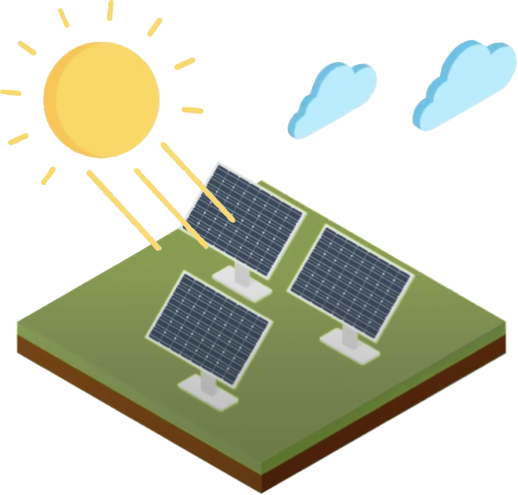
Solar Plants
Actual irradiance and weather.
-
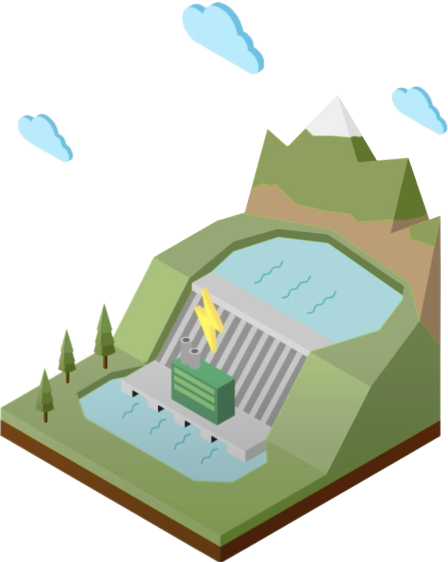
Hydro Plants
Flow in rate and actual weather.
e-API
The e-API provides your plant information and your power production data.
You will be able to view and analyze plant energy and production data,
and to query such data using the e-API in order to integrate them
into your own dashboard and/or ERP system.
-
PPA INFO
-
PLANT INFO
-
PLANT ENERGY INFO
PPA Summary
Through the Summary Page you can share your sustainable indicators
that show your commitment to decarbonization process.
- Total amount of energy
- Total amount of avoided CO2
- Amount of energy produced today
- Power Plant Data

